Evolutionary Coupling Analysis
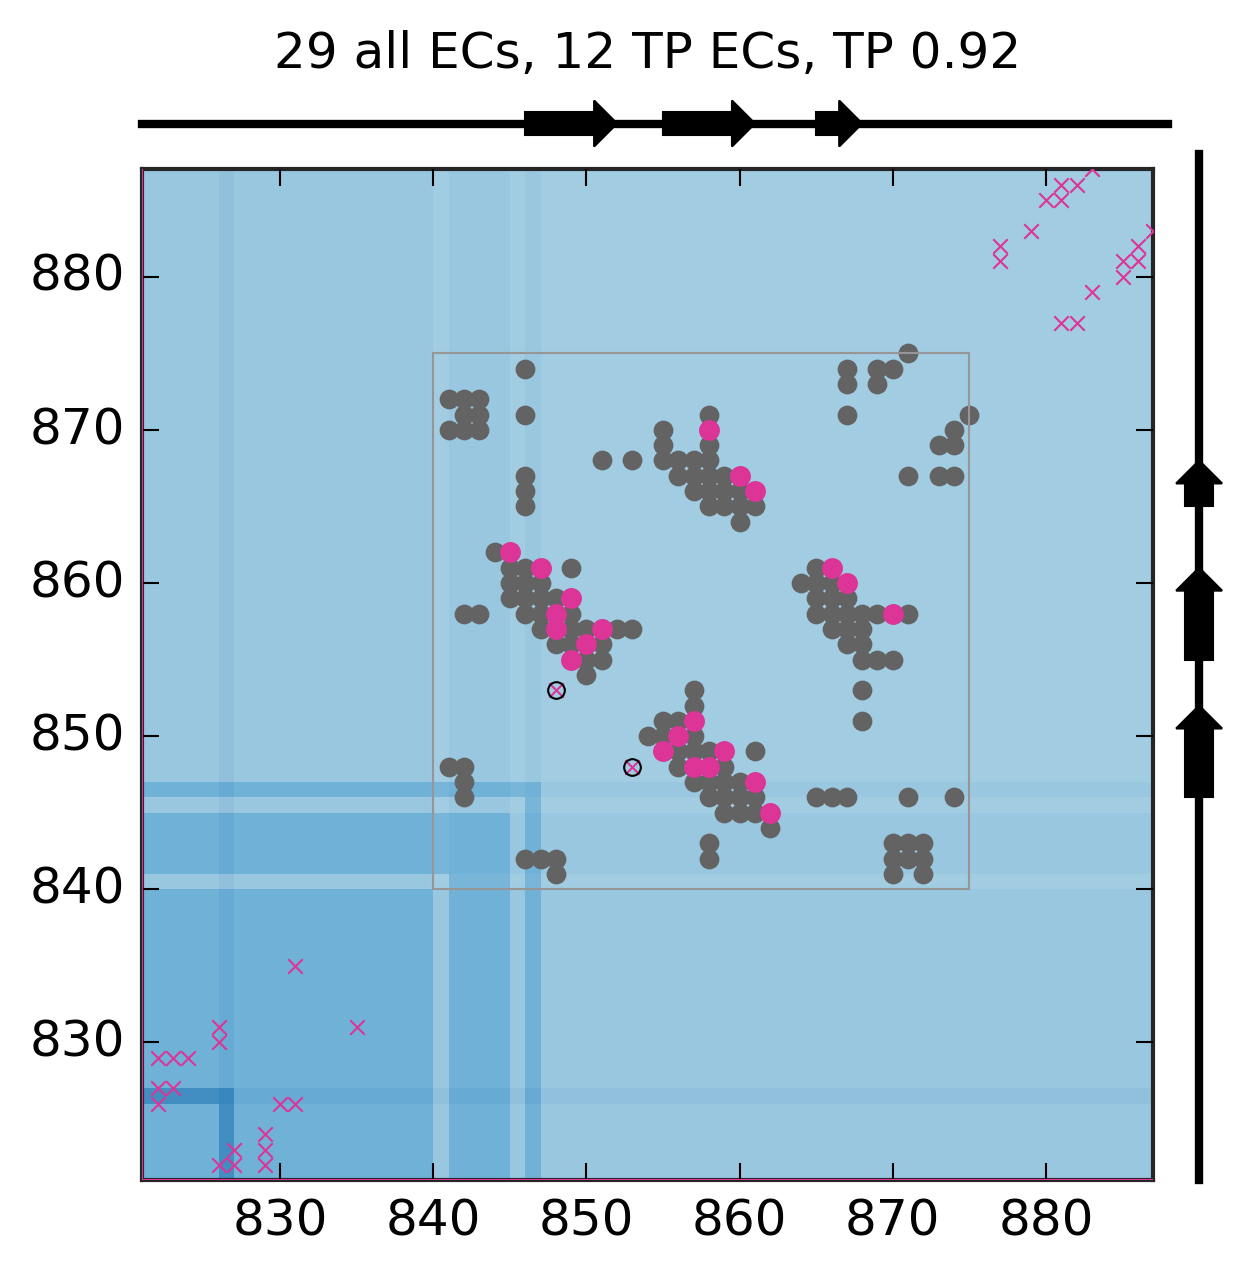
Predicted and experimental contacts
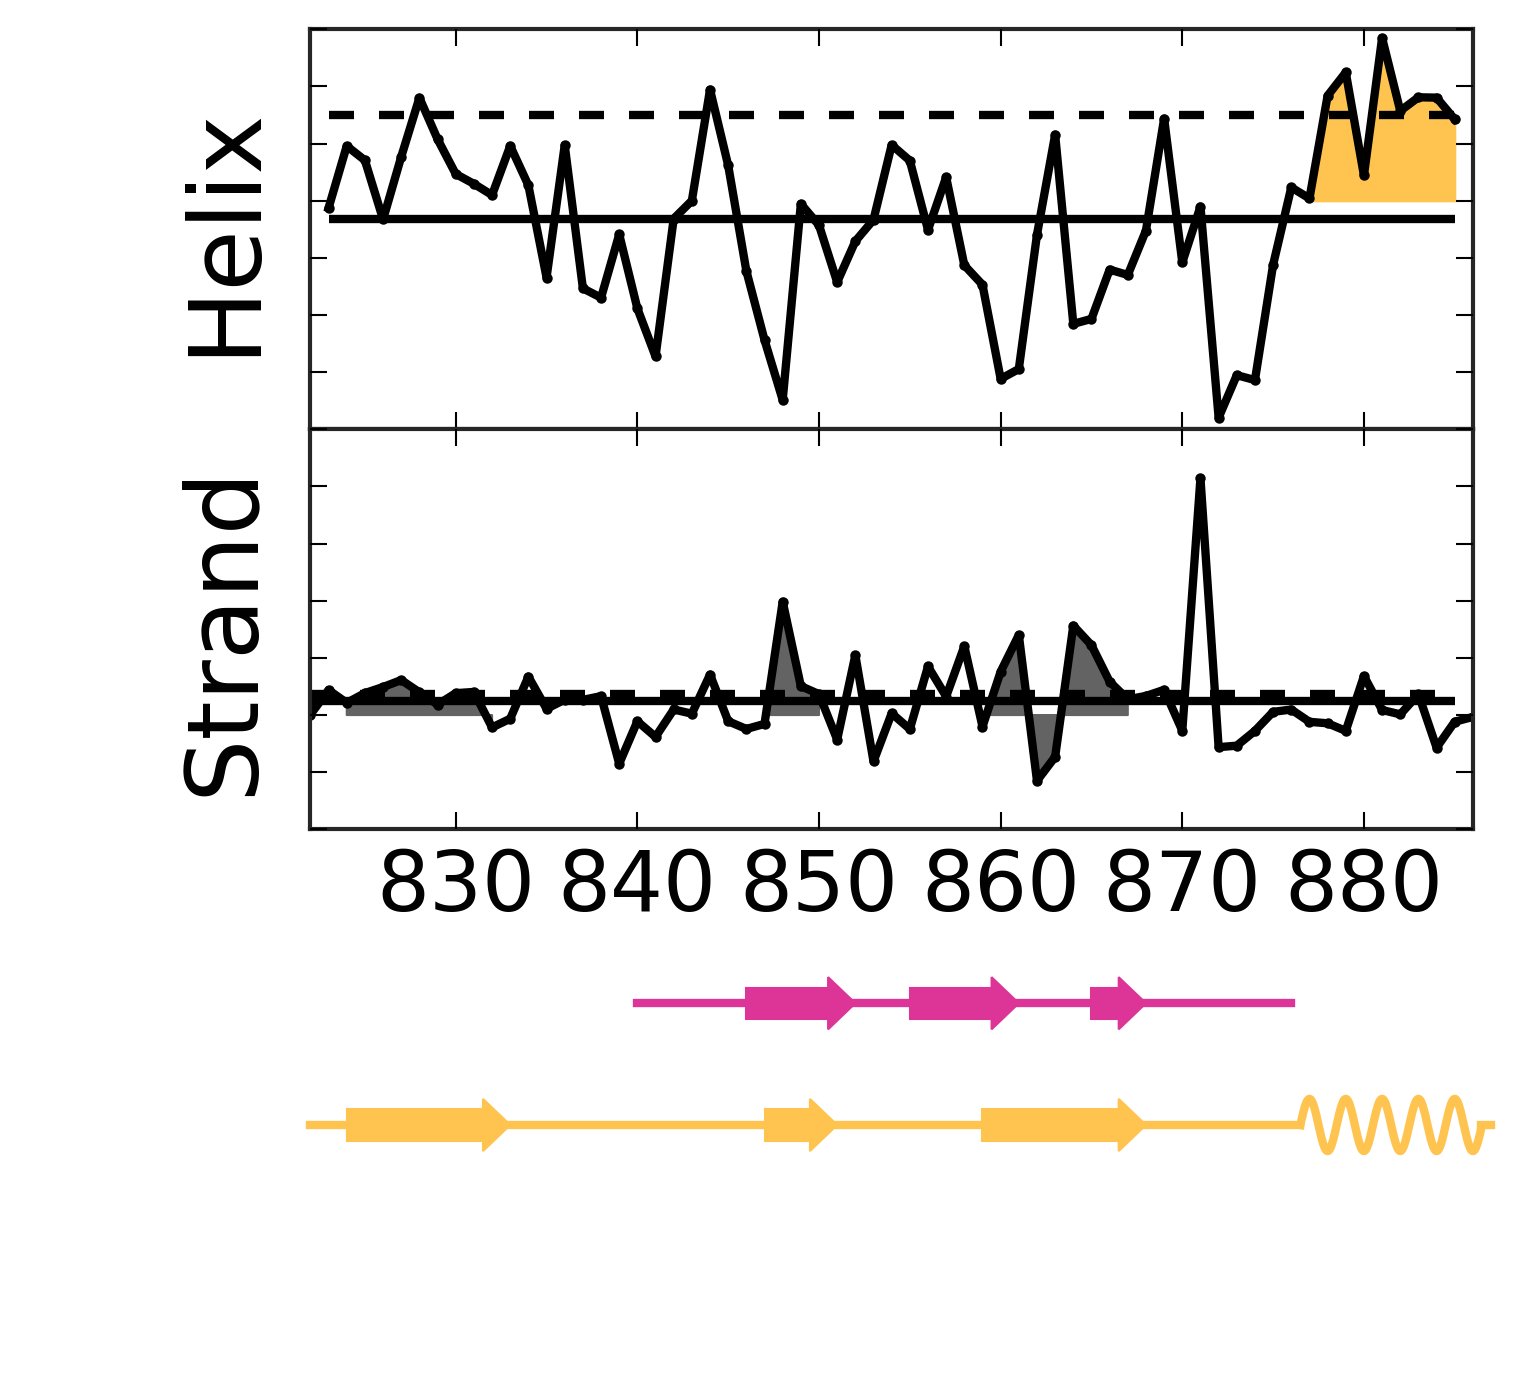
Secondary structure from ECs
Known pdb structures
| pdb |
chain |
| 2kpz |
A |
| 2kq0 |
A |
| 4n7h |
A |
EC score distribution and threshold
Top ECs
| Rank |
Residue 1 |
Amino acid 1 |
Residue 2 |
Amino acid 2 |
EC score |
| 1 |
849 |
R |
855 |
R |
0.71 |
| 2 |
849 |
R |
859 |
I |
0.60 |
| 3 |
860 |
D |
867 |
T |
0.51 |
| 4 |
882 |
K |
886 |
D |
0.49 |
| 5 |
858 |
F |
870 |
D |
0.48 |
| 6 |
877 |
A |
881 |
G |
0.47 |
| 7 |
824 |
T |
829 |
Q |
0.46 |
| 8 |
826 |
D |
831 |
V |
0.45 |
| 9 |
879 |
L |
883 |
T |
0.45 |
| 10 |
881 |
G |
886 |
D |
0.44 |
| 11 |
883 |
T |
887 |
T |
0.42 |
| 12 |
822 |
A |
826 |
D |
0.41 |
| 13 |
823 |
S |
829 |
Q |
0.41 |
| 14 |
826 |
D |
830 |
Q |
0.40 |
| 15 |
847 |
E |
861 |
H |
0.39 |
| 16 |
881 |
G |
885 |
L |
0.39 |
| 17 |
877 |
A |
882 |
K |
0.39 |
| 18 |
822 |
A |
827 |
S |
0.39 |
| 19 |
845 |
G |
862 |
N |
0.39 |
| 20 |
848 |
V |
857 |
F |
0.38 |
| 21 |
831 |
V |
835 |
S |
0.38 |
| 22 |
848 |
V |
853 |
N |
0.37 |
| 23 |
880 |
R |
885 |
L |
0.37 |
| 24 |
848 |
V |
858 |
F |
0.37 |
| 25 |
850 |
H |
856 |
P |
0.37 |
| 26 |
861 |
H |
866 |
T |
0.36 |
| 27 |
851 |
A |
857 |
F |
0.36 |
| 28 |
822 |
A |
829 |
Q |
0.36 |
| 29 |
823 |
S |
827 |
S |
0.36 |
Alignment robustness analysis
First most common residue correlation
Second most common residue correlation